
TRACK 2: From Bench to Bedside: Bioanalysis and Translational Science
Category: Poster Abstract
Muthu Lakshmi
Custom Biologics, United States
Kalhari Silva
Custom Biologics, United States
Dan Mamelak
Custom Biologics
Etobicoke, Canada
Rahul Ghugari
Custom Biologics, United States
Riya Puri
Custom Biologics, United States
Carlie Goodall
Custom Biologics, United States
Kausy Gopal
Custom Biologics, United States
Tam Bui
Custom Biologics, United States
.jpg) Figure 1. Schematic representation of an immunogenicity assay to measure the anti-drug antibody response to an oncolytic virus.
Figure 1. Schematic representation of an immunogenicity assay to measure the anti-drug antibody response to an oncolytic virus. 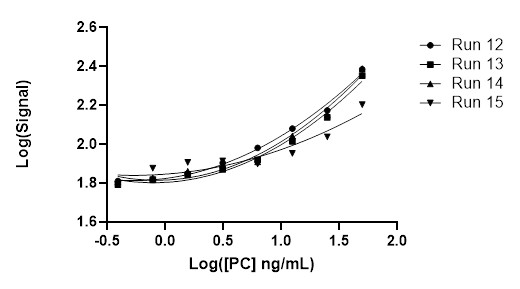 Figure 2. Assay Sensitivity. Graph of assay Log10(signal) vs Log10([PC] ng/mL) across 4 runs. Sensitivity was determined by back calculating the concentration at which the sensitivity curve meets the cut point. The mean value of sensitivity between runs (n=4) was 4.38 ng/mL.
 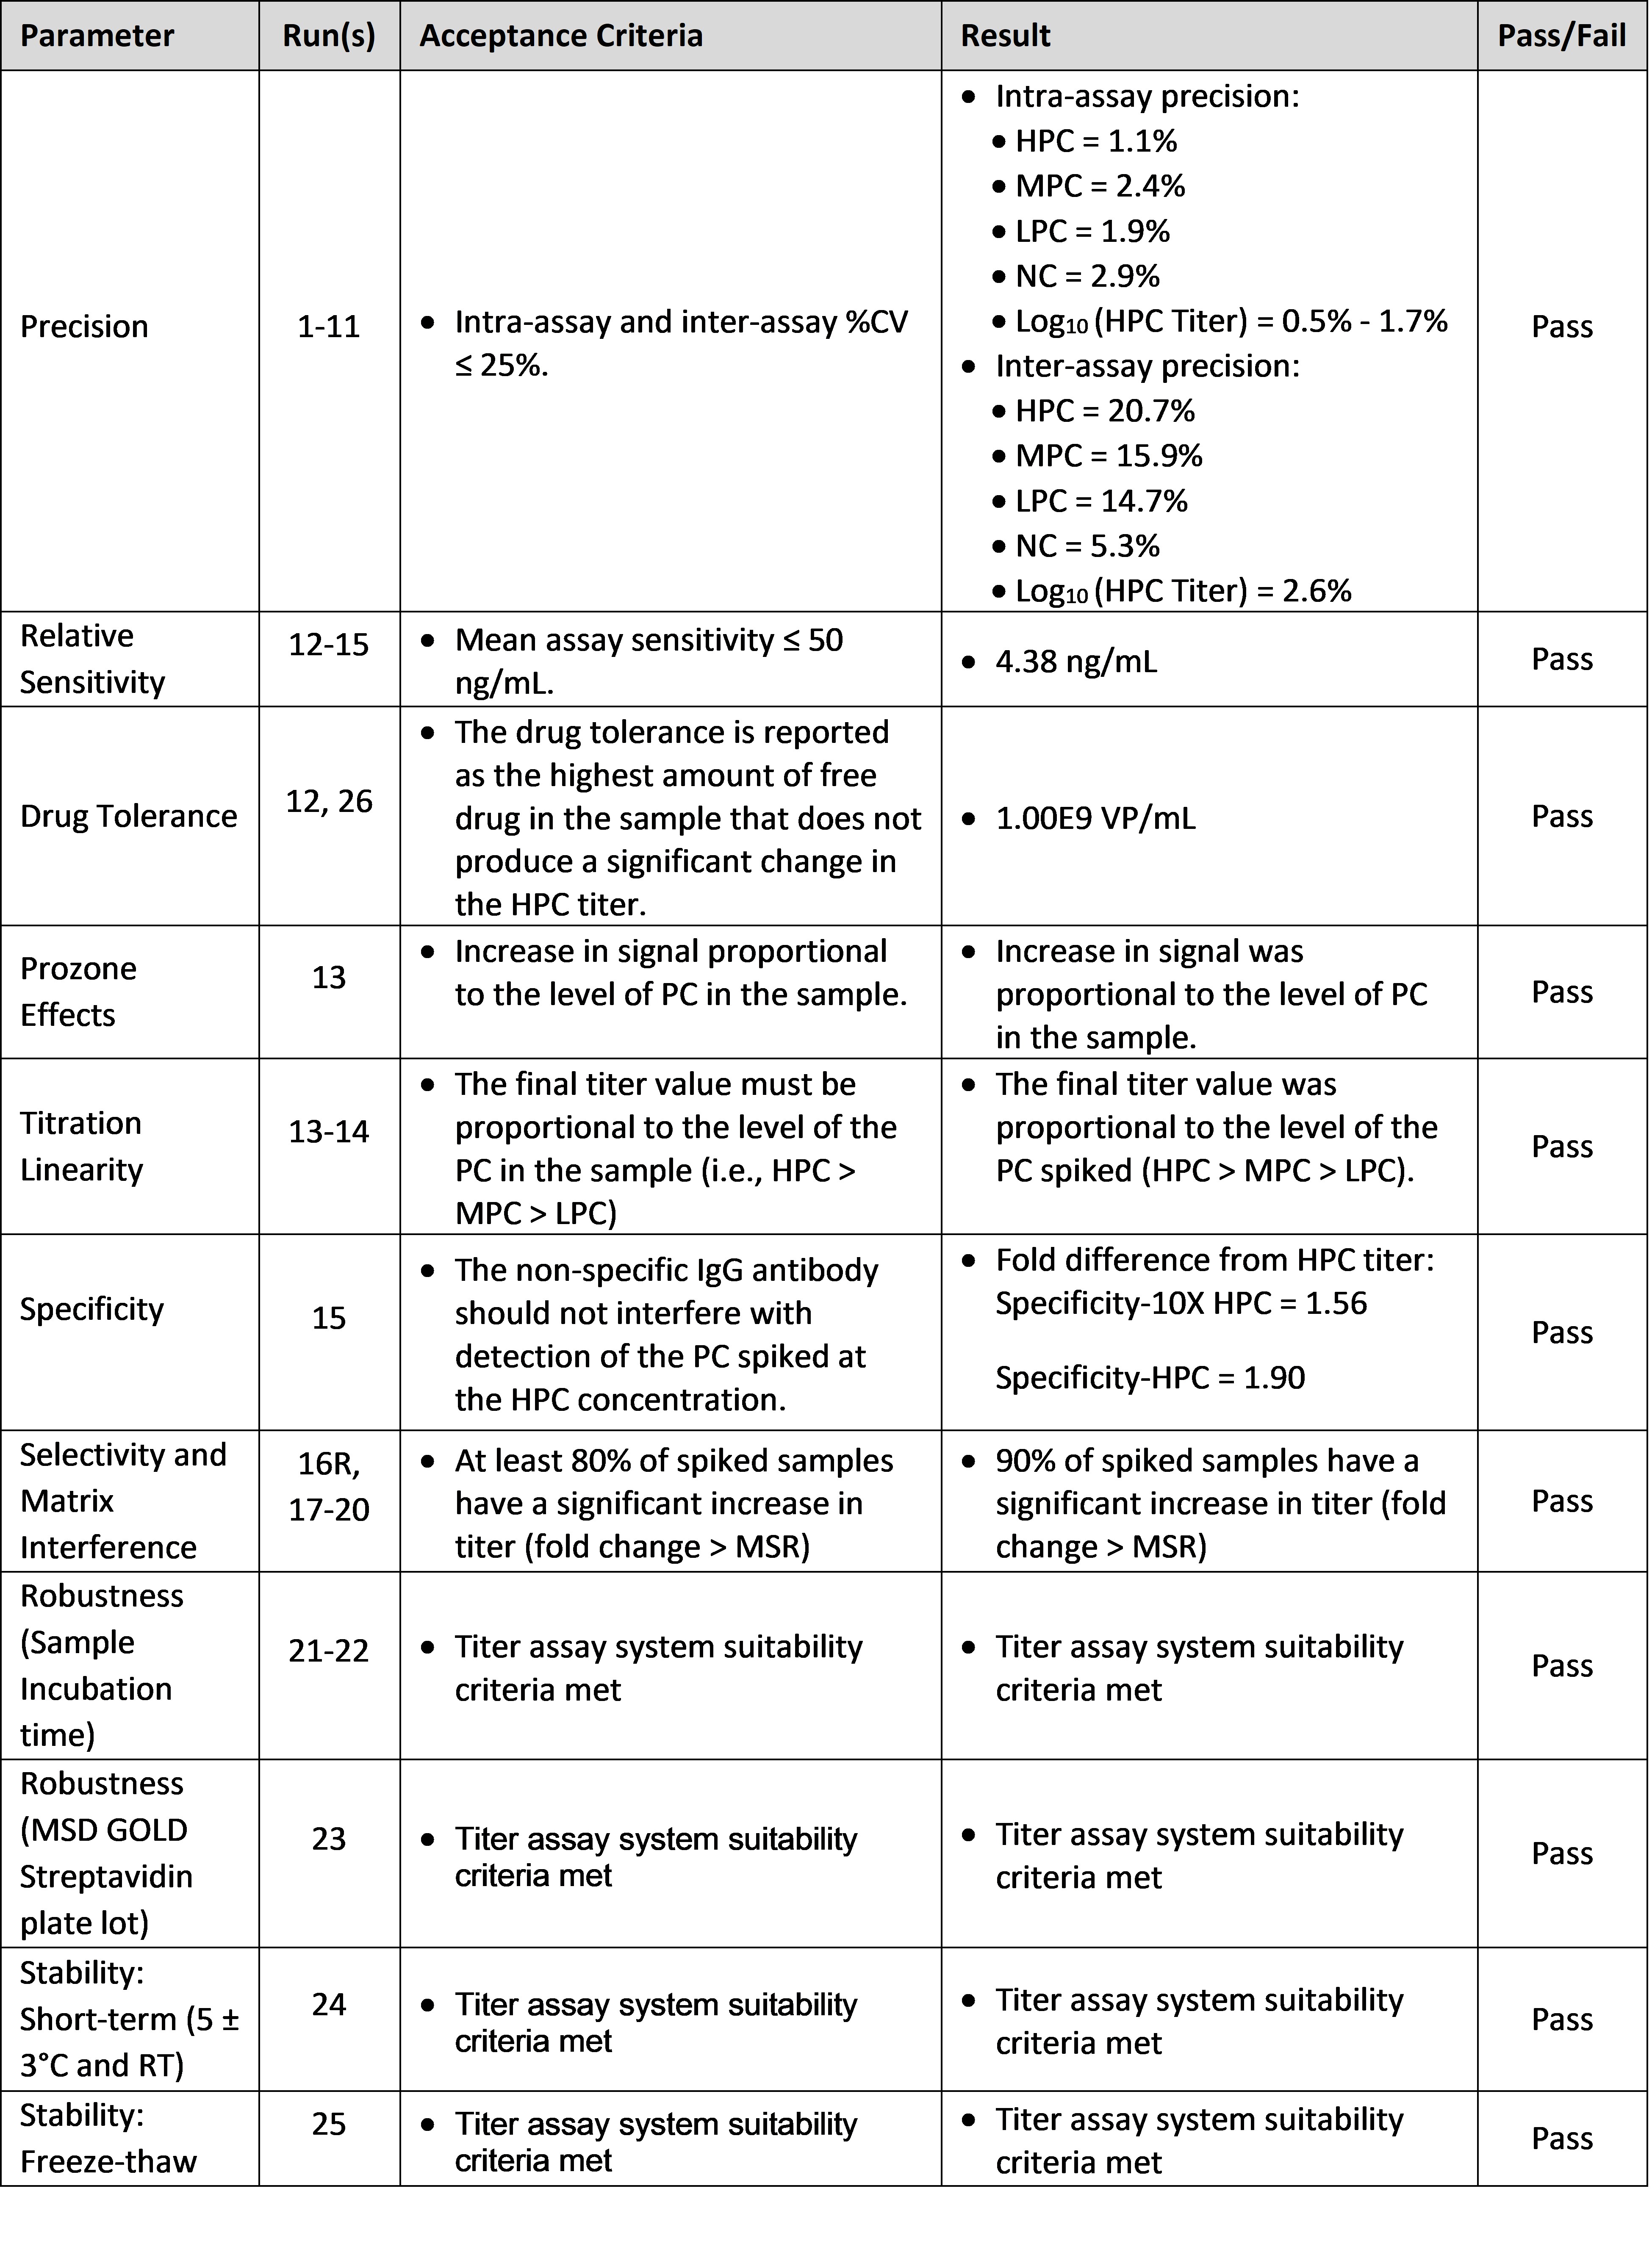 Table 1. Summary of Validation Criteria