TRACK 1: Inspiring Innovation in Formulation, Bioprocessing, and Drug Delivery
Category: Poster Abstract
 photo")
Angeliki Andrianopoulou, PharmD, MSc (she/her/hers)
PhD Student
University of Illinois Chicago
Chicago, Illinois, United States
Angeliki Andrianopoulou, PharmD, MSc (she/her/hers)
PhD Student
University of Illinois Chicago
Chicago, Illinois, United States
Sonia Alavi
Ph.D. Candidate
Univeristy of Illinois Chicago
Chicago, Illinois, United States

Richard Gemeinhart
Professor of Pharmaceutics and Bioengineering
University of Illinois Chicago
Chicago, Illinois, United States
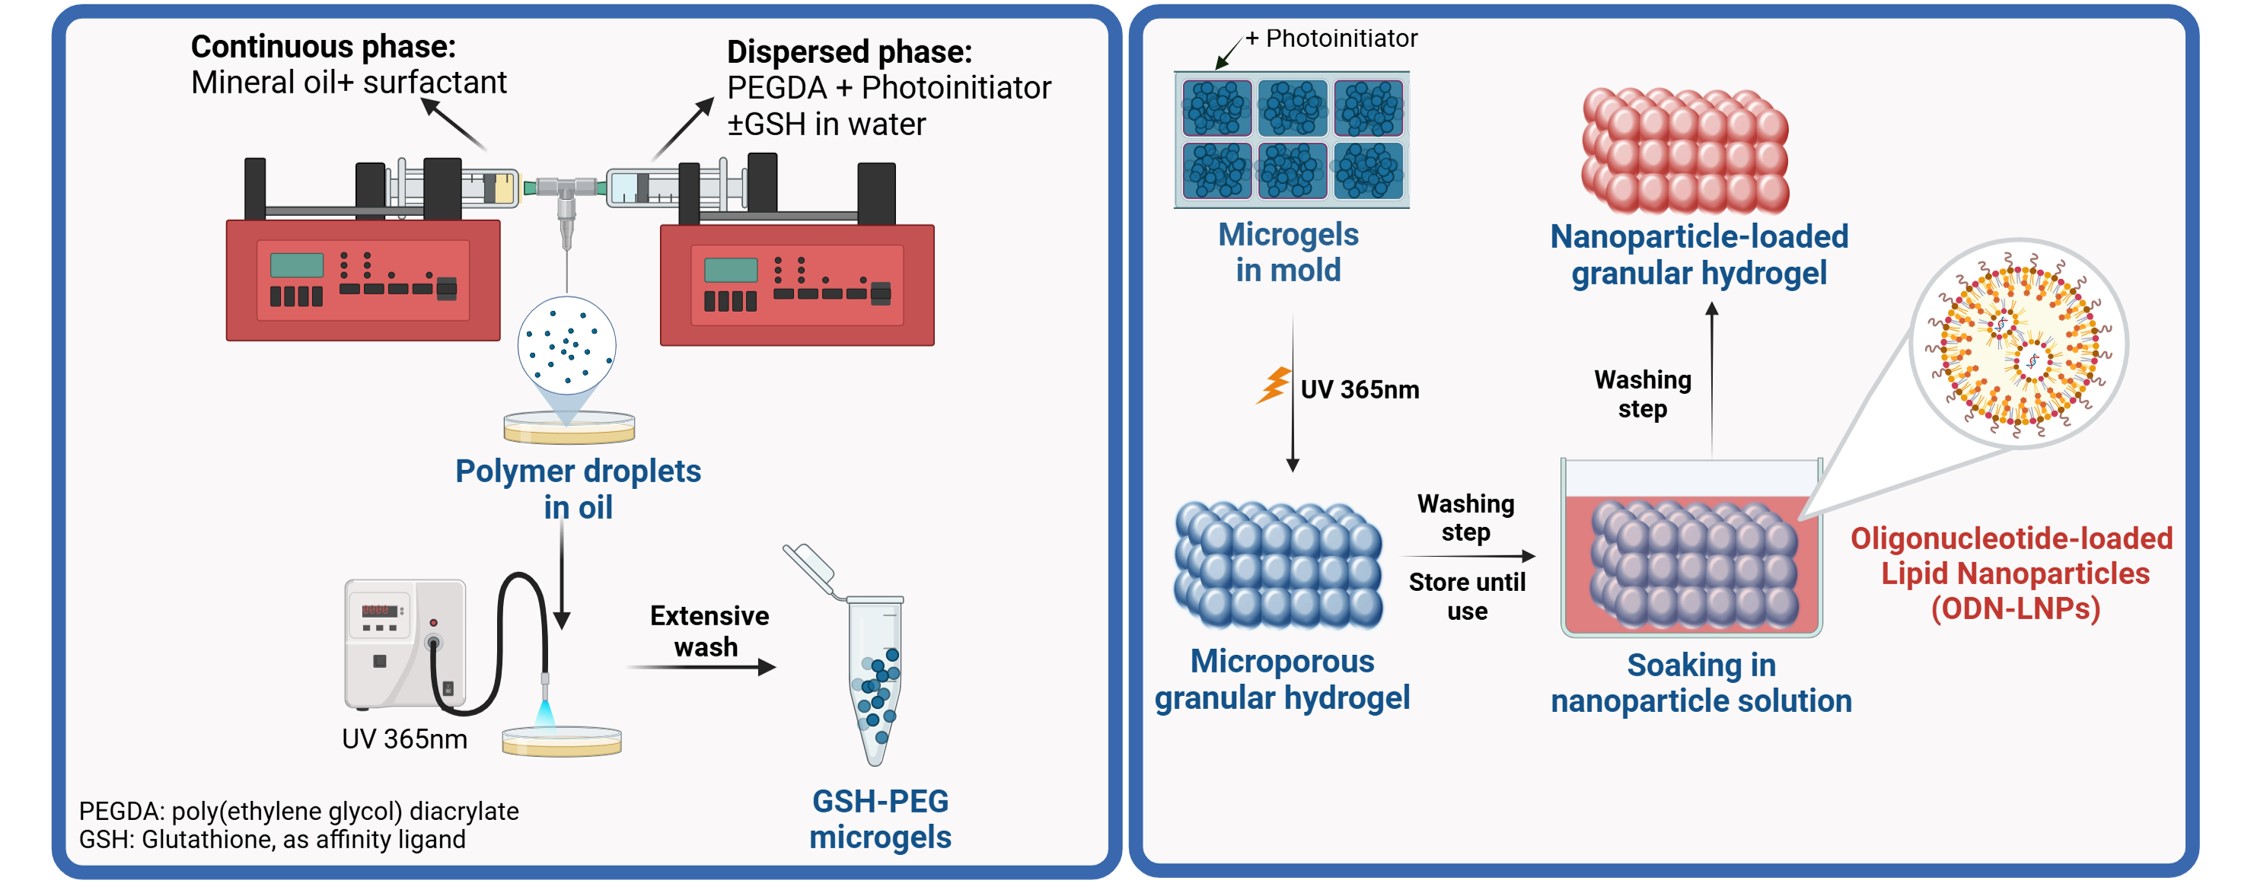 Figure 1. Schematic illustration of the microgel fabrication method and nanoparticle loading process in the granular hydrogel.
.jpg) Figure 2. (A) Microgel diameter (μm) as a function of varying the continuous flow rate (Qc) at constant dispersed flow rate of 1μL/min. Inset: microscope image of the produced microgels. Scale bar: 100μm. (B) Microgel diameter (μm) and coefficient of variation (%) as a function of total flow rate (μL/min). Data presented for three replicates, with measurements obtained from ten particles per replicate. (C) Microscopy image of hydrated (left) and lyophilized (right) granular hydrogel obtained with Keyence VHX6000 digital microscope. Scale bar: 500μm.
Figure 2. (A) Microgel diameter (μm) as a function of varying the continuous flow rate (Qc) at constant dispersed flow rate of 1μL/min. Inset: microscope image of the produced microgels. Scale bar: 100μm. (B) Microgel diameter (μm) and coefficient of variation (%) as a function of total flow rate (μL/min). Data presented for three replicates, with measurements obtained from ten particles per replicate. (C) Microscopy image of hydrated (left) and lyophilized (right) granular hydrogel obtained with Keyence VHX6000 digital microscope. Scale bar: 500μm.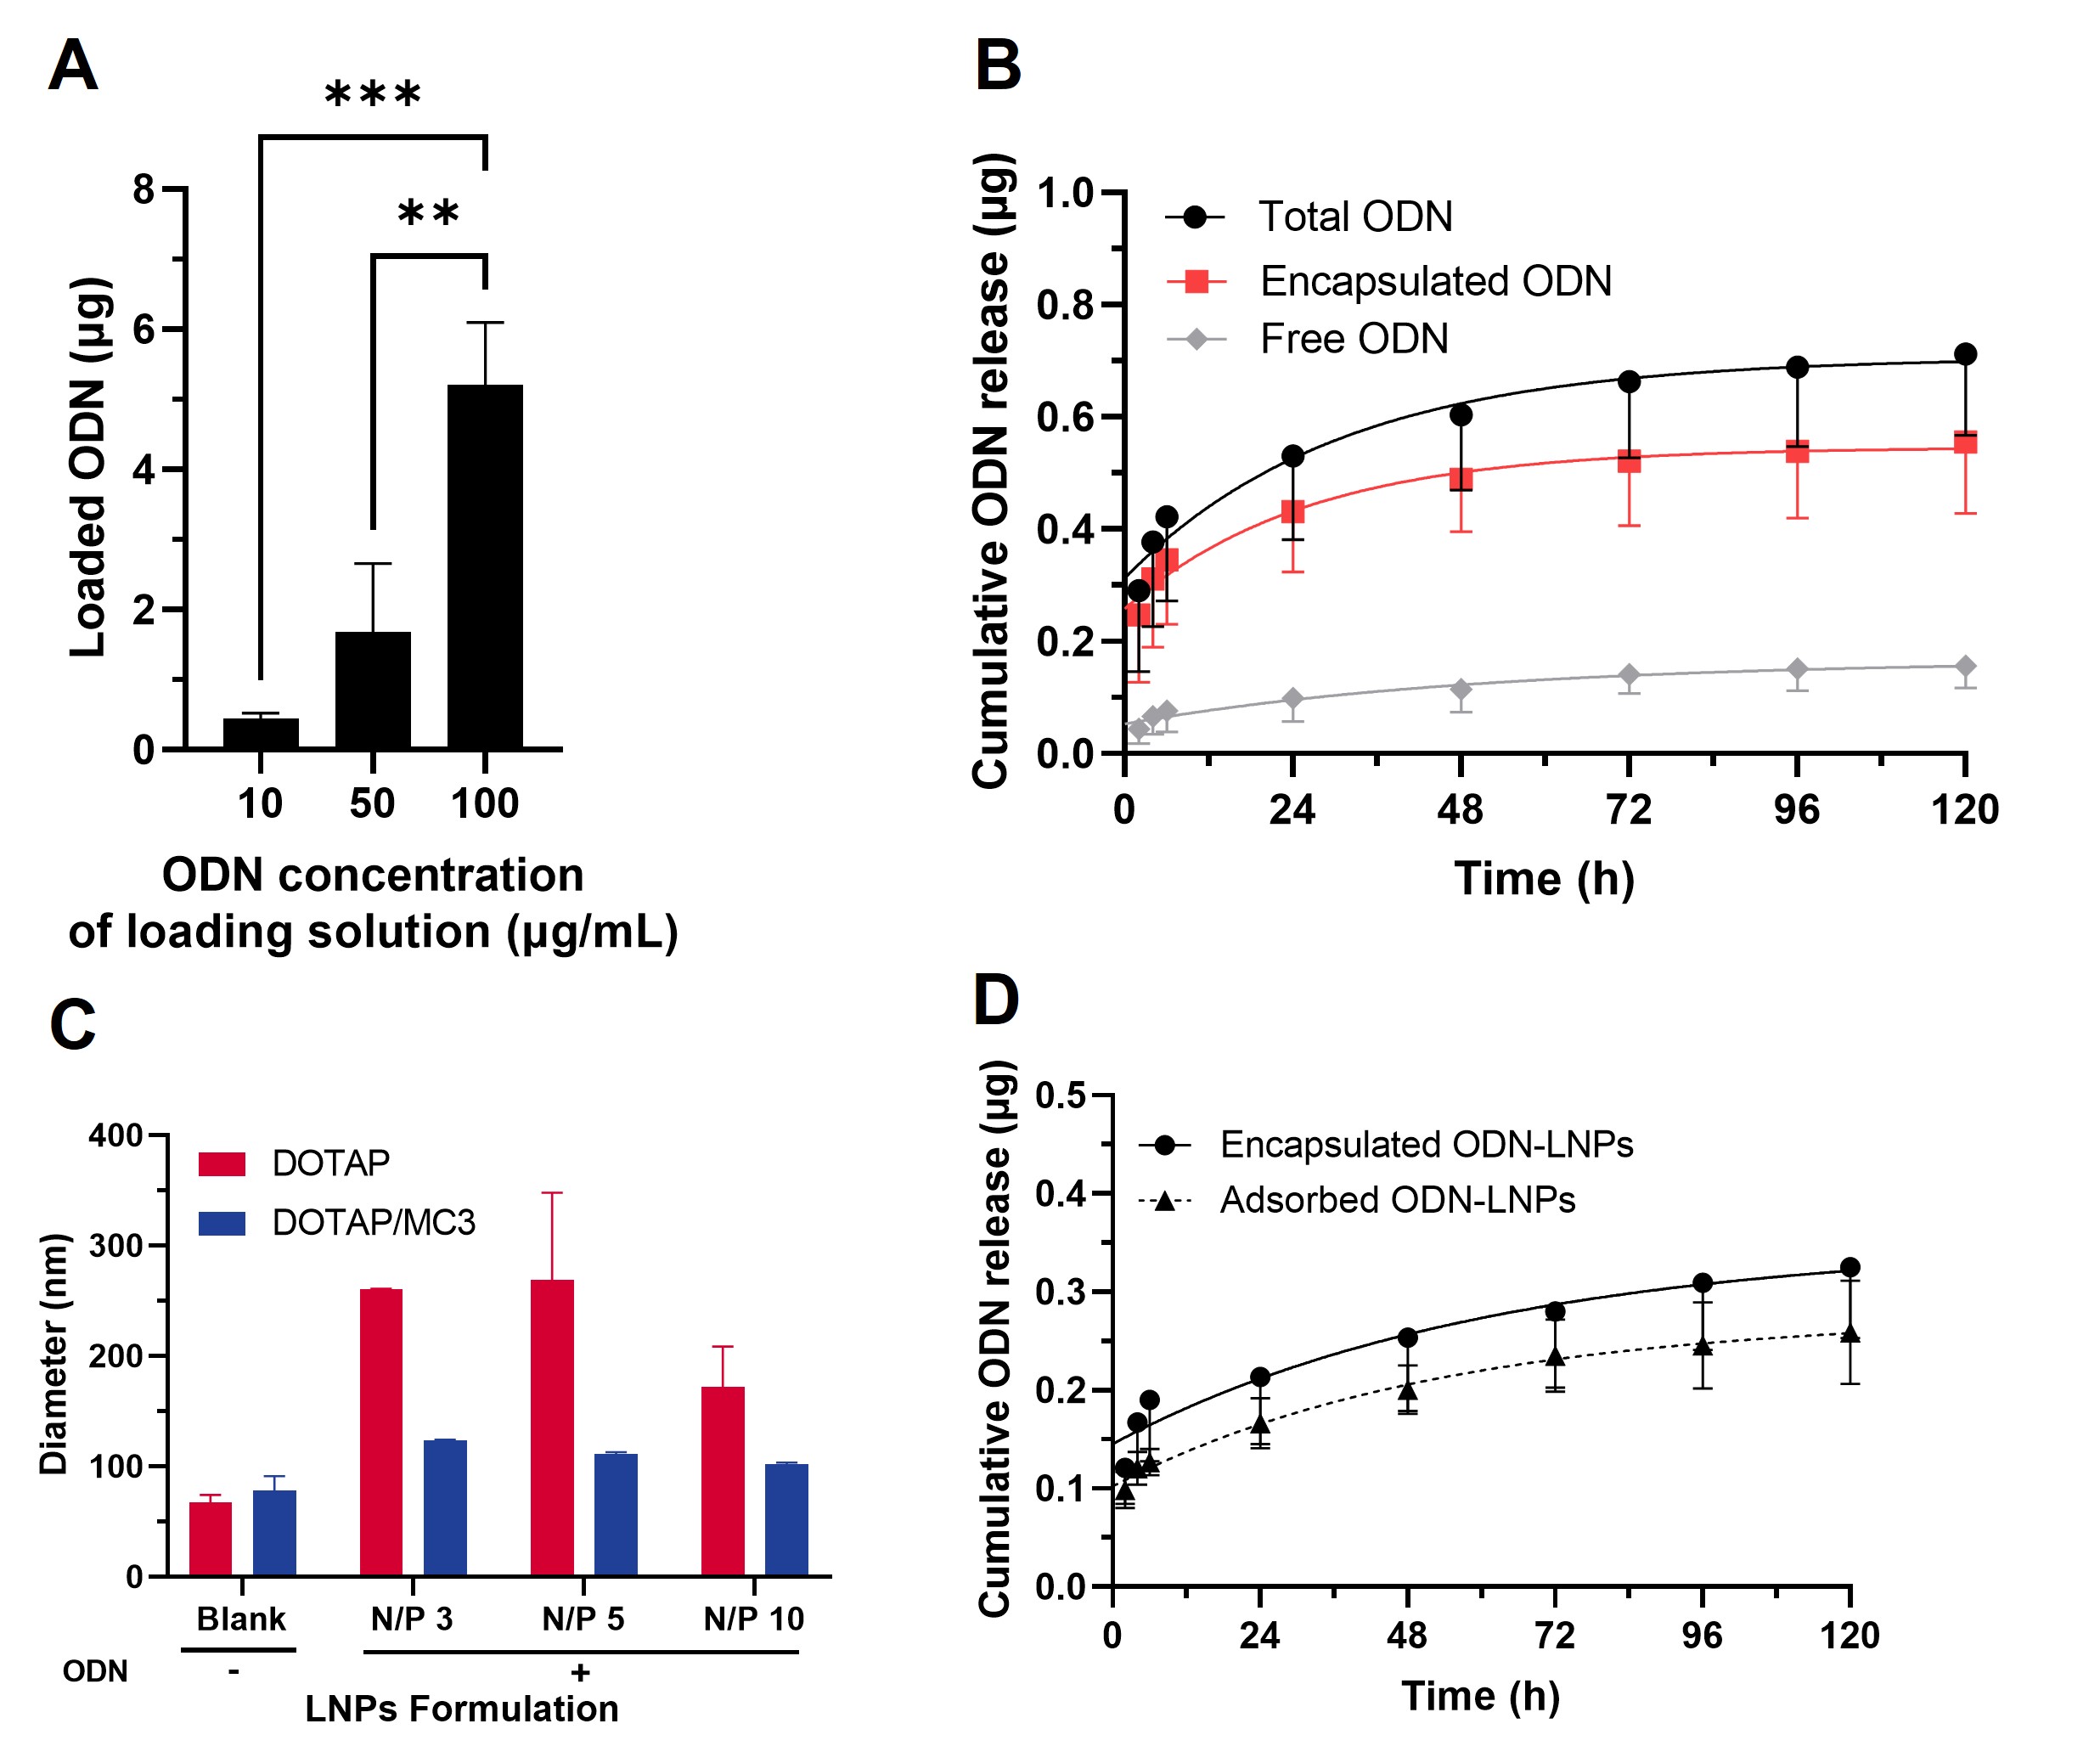 Figure 3. (A) ODN loading (μg) of encapsulated ODN-LNPs in granular hydrogel at varying ODN loading stock concentrations (μg/mL). (B) Release of total, encapsulated and free ODN from encapsulated ODN-LNPs in granular hydrogel at 100μg/mL ODN stock concentration, as quantified using the RiboGreen assay. (C) Diameter (nm) of LNPs prepared with DOTAP or DOTAP/ D-Lin-MC3-DMA cationic/ionizable lipids upon adsorption of ODN at varying N/P ratios. (D) Release of ODN from encapsulated DOTAP-LNPs or adsorbed DOTAP/ D-Lin-MC3-DMA-LNPs from granular hydrogel at 50μg/mL loading stock ODN concentration, as quantified using the RiboGreen assay.