
TRACK 1: Inspiring Innovation in Formulation, Bioprocessing, and Drug Delivery
Category: Poster Abstract
Dominik Brandstetter (he/him/his)
Coriolis Pharma Research GmbH
Martinsried, Germany
Dominik Brandstetter (he/him/his)
Coriolis Pharma Research GmbH
Martinsried, Germany
Max Unger (he/him/his)
Coriolis Pharma Research GmbH, Germany
Tim Menzen (he/him/his)
Coriolis Pharma Research GmbH
Matrinsried, Bayern, Germany
Hristo Svilenov (he/him/his)
Technical University, Germany
Andrea Arsiccio (he/him/his)
Coriolis Pharma Research GmbH
Martinsried, Bayern, Germany
.jpg) Figure 1. Additivity of GTFEs for multi-component solutions. Correlation between GTFEs obtained via linear combinations of single-component GTFEs vs. experimentally determined GTFEs. 1 M sucrose + 0.5 M NaCl is shown in black, 0.5 M sucrose + 0.5 M ArgHCl in red, 0.5 M sucrose + 0.5 M ArgHCl + 0.04% PS20 in blue, and 0.5 M NaCl + 0.5 M ArgHCl in green.
Figure 1. Additivity of GTFEs for multi-component solutions. Correlation between GTFEs obtained via linear combinations of single-component GTFEs vs. experimentally determined GTFEs. 1 M sucrose + 0.5 M NaCl is shown in black, 0.5 M sucrose + 0.5 M ArgHCl in red, 0.5 M sucrose + 0.5 M ArgHCl + 0.04% PS20 in blue, and 0.5 M NaCl + 0.5 M ArgHCl in green..jpg) Figure 2. MD simulation results for the G-CSF formulation screening. The distributions of α-helical content and number of intermolecular hydrogen bonds are shown for different formulations at pH 3.5 and 7.0. Representative proteins conformation as extracted from the MD trajectories are also shown in each panel.
Figure 2. MD simulation results for the G-CSF formulation screening. The distributions of α-helical content and number of intermolecular hydrogen bonds are shown for different formulations at pH 3.5 and 7.0. Representative proteins conformation as extracted from the MD trajectories are also shown in each panel.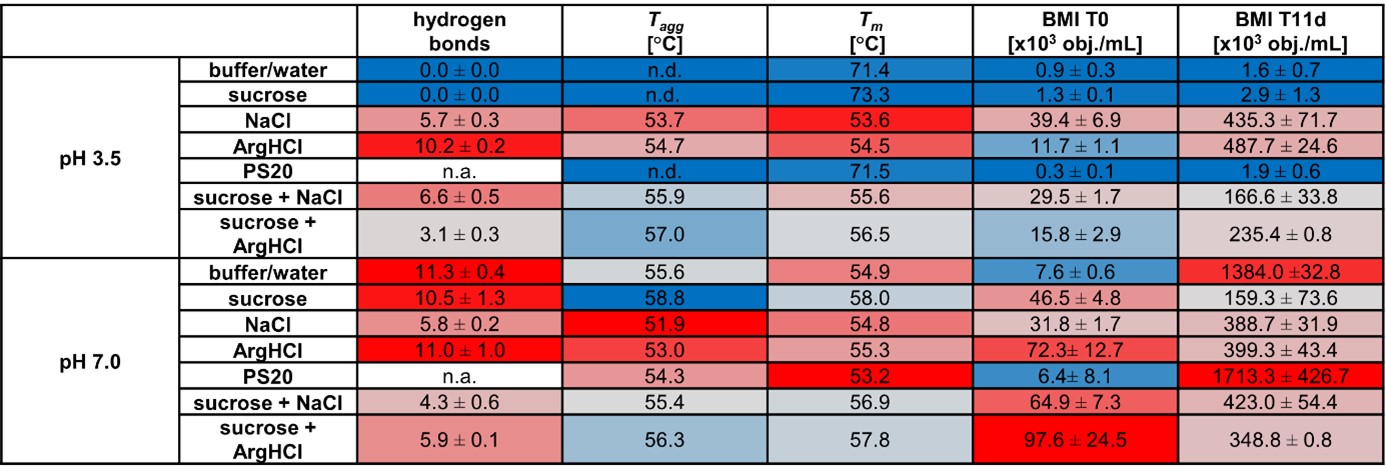 Table 1. G-CSF formulation screening results shown as heat map. Red indicates protein destabilization, whereas blue suggests protein stabilization. The first column (hydrogen bonds) summarizes the mean number of intermolecular hydrogen bonds from the MD simulations. The subsequent columns are the experimental data, i.e., the onset temperature of aggregation (Tagg), the apparent melting temperature (Tm) from nanoDSF, and the particle burden obtained by BMI at T0 and after 11 days incubation at 37 °C. For the simulation data (i.e., number of hydrogen bonds) errors were estimated by block averaging. Briefly, the equilibrated trajectories were divided into four blocks and the standard deviation computed over the average values in each of the blocks. For the experimental data, values are provided as mean ± standard deviation from n=3 measurements. Standard deviations for Tm and Tagg were for all measurements below 0.1 °C. Abbreviations: not detected (n.d.); not available (n.a).