TRACK 1: Inspiring Innovation in Formulation, Bioprocessing, and Drug Delivery
Category: Poster Abstract
(T1030-02-07) Viscosity Reduction of an IgG1 Antibody via Hydrogen-Deuterium Exchange Mass Spectrometry-Augmented Protein Engineering
Tuesday, May 6, 2025
10:30 AM - 11:30 AM ET

Tyler Lefevre, PhD (he/him/his)
Postdoctoral Fellow
AstraZeneca
Gaithersburg, Maryland, United States
Tyler Lefevre, PhD (he/him/his)
Postdoctoral Fellow
AstraZeneca
Gaithersburg, Maryland, United States- JC
Jenna Caldwell
AstraZeneca, United States
- AG
Austin Gallegos
AstraZeneca, United States
- EH
Erin Houston
Eurofins PSS Insourcing Solutions, United States
- GK
Gilad Kaplan
AstraZeneca, United States
- RE
Reza Esfandiary
AstraZeneca, United States
Presenting Author(s)
Main Author(s)
Co-Author(s)
Purpose: Patients indicate a preference for at-home, subcutaneous (SC) delivery of therapeutics as a matter of convenience, time savings, and monetary cost [1]. To improve the SC injection experience, drug developers may seek a low injection volume ( ≤ 1.5 mL), which for some antibody drugs necessitates a high concentration solution (≥ 150 mg/mL) to meet dosage requirements. Several molecular-level challenges hinder the development of high concentration antibody drug products, including viscosity caused by reversible self-association (RSA) of antibody proteins. This RSA can be driven by protein surface features such as electrostatic [2, 3] or hydrophobic patches [4, 5], or by post-translational modifications. Typically, antibody engineering to reduce viscosity via mutagenesis relies on 3D structures attained via high-resolution structural methods like X-ray crystallography [5] or electron microscopy, or by building sequence-derived homology models in silico [6-8]. These methods are powerful and informative, but they do not report on RSA interactions or interaction sites, leaving researchers to rely on historical tendencies and surface modeling for engineering proteins to reduce RSA.
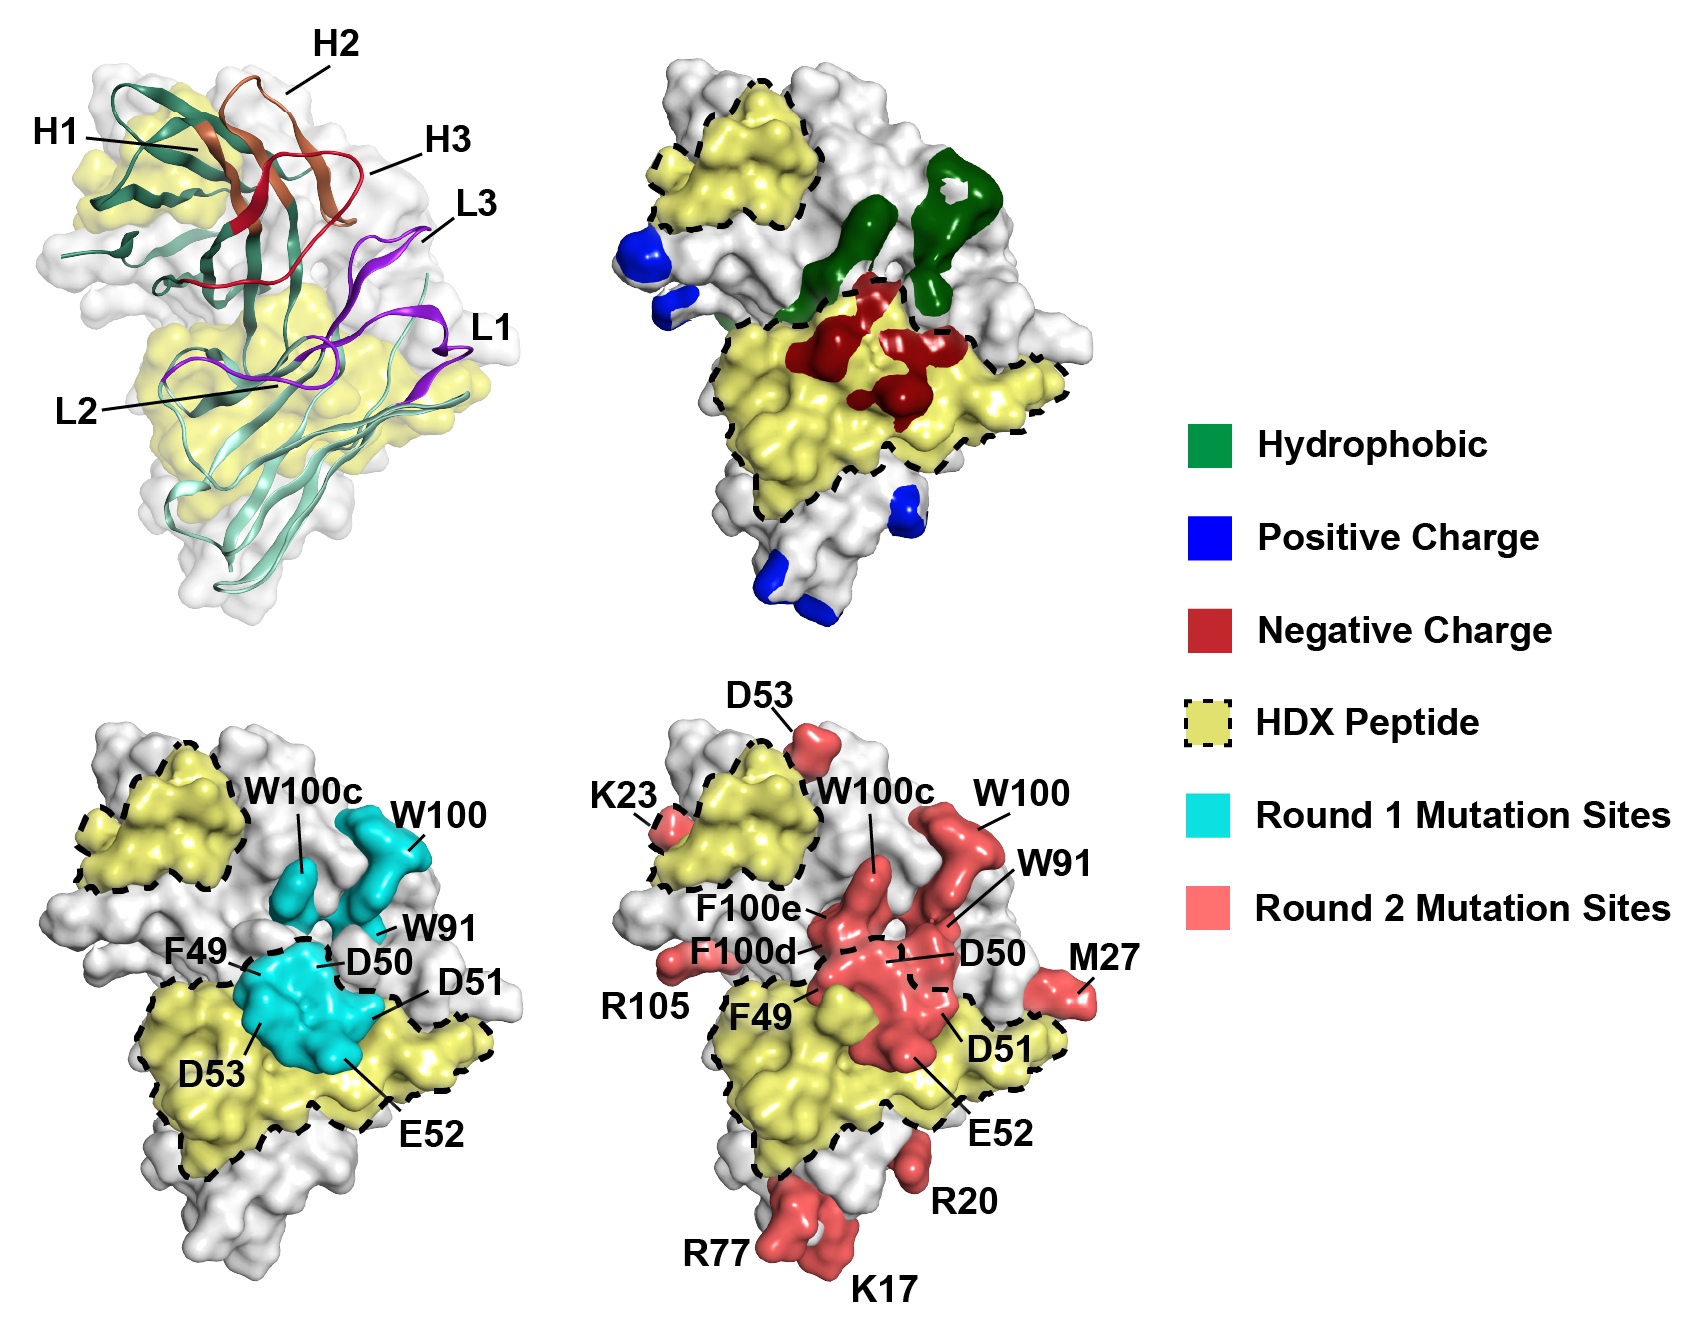
Methods: Here, we take an enhanced rational design approach to reduce RSA via protein engineering. Using hydrogen-deuterium exchange mass spectrometry (HDX-MS), we identified potential self-interaction hotspots on the surface of a proprietary IgG1 monoclonal antibody (mAb A) which has known viscosity issues at high concentration. Next, using in silico antibody modeling, we rationally designed mutations in the Fv, targeting sites which included predicted electrostatic or hydrophobic patches within or near peptides highlighted by HDX-MS. Thirty-three variants including mutations at 18 different residues were screened using dynamic light scattering (DLS)[9, 10] and affinity capture self-interaction nanospectroscopy (AC-SINS)[11] at low concentration to evaluate RSA and predict viscosity at high concentration. Select variants were tested for viscosity, and all were evaluated for antigen binding affinity.
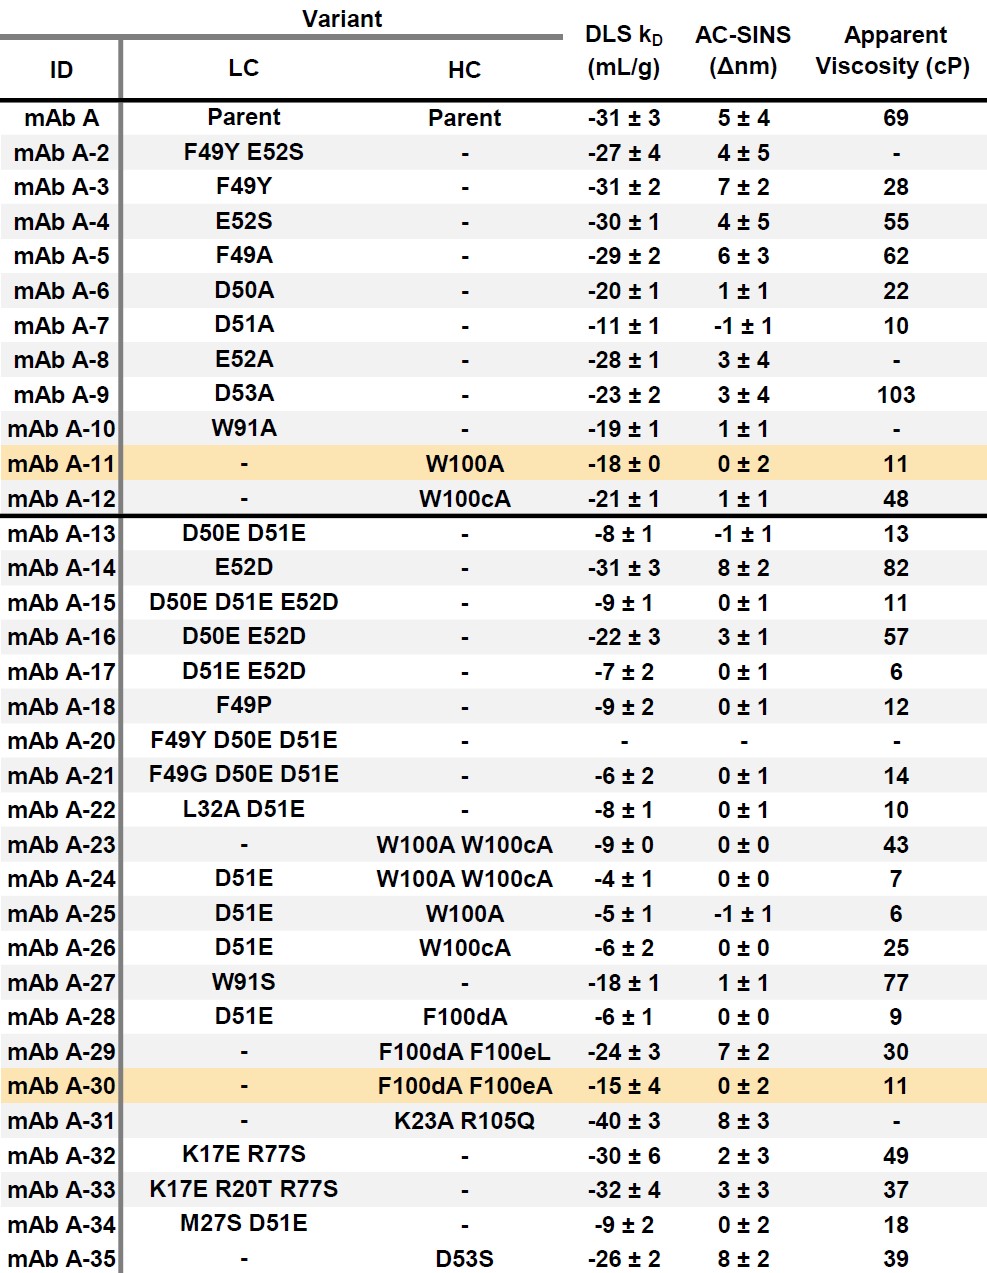
Results: Of the 33 variants, 27 showed a decrease in self-interaction via diffusion interaction parameter kD obtained via DLS. Viscosity at 150 mg/mL in a common histidine formulation buffer was reduced from nearly 70 centipoise (cP) to < 20 cP for 13 variants. Mutation of residues along a negatively charged patch in CDRL2 was effective in reducing viscosity up to 90% at 150 mg/mL. Two variants designed to reduce surface hydrophobicity retained antigen binding compared to the parent mAb in addition to lowering viscosity over 80% at 150 mg/mL. Ablation of positive charge on the Fv surface using mutagenesis was less effective, showing similar kD values as the parent mAb and only modest viscosity reduction at 150 mg/mL. DLS and AC-SINS measurements of self-association were found to correlate with viscosity at high concentration, reinforcing their role as effective low-concentration screening tools for RSA.
Conclusion: The utility of HDX-MS in defining surfaces of self-interaction is demonstrated, which in combination with in silico predictions of surface properties, offers high confidence in improving mAb developability with rational mutagenesis. Substantial viscosity reduction of a problematic IgG1 at 150 mg/mL was achieved by mutating as little as one residue on the Fv surface within a peptide discovered in HDX-MS experiments. The mechanism of self-association for this mAb likely includes contributions from hydrophobic surface interactions as well as electrostatic interactions. Replacement of certain negatively charged CDRL2 residues drastically reduced viscosity at high concentration, but this effect was observed regardless of replacement residue. Reducing positive charge on the Fv surface near HDX-identified peptides did not substantially impact RSA at low concentrations or high concentration viscosity. Targeting patches of surface hydrophobicity near HDX-identified regions offered modest to strong viscosity reduction while minimally impacting target binding affinity.
References: 1. Stevenson, J., et al., Pharmaceutical and biotech industry perspectives on optimizing patient experience and treatment adherence through subcutaneous drug delivery design. Advanced Drug Delivery Reviews, 2024. 209: p. 115322.
2. Yadav, S., S.J. Shire, and D.S. Kalonia, Factors affecting the viscosity in high concentration solutions of different monoclonal antibodies. J Pharm Sci, 2010. 99(12): p. 4812-29.
3. Yadav, S., et al., Specific interactions in high concentration antibody solutions resulting in high viscosity. J Pharm Sci, 2010. 99(3): p. 1152-68.
4. Lai, P.-K., et al., Machine learning prediction of antibody aggregation and viscosity for high concentration formulation development of protein therapeutics. mAbs, 2022. 14(1).
5. Dai, J., et al., Variable domain mutational analysis to probe the molecular mechanisms of high viscosity of an IgG1 antibody. mAbs, 2024. 16(1).
6. Molecular Operating Environment (MOE). 8, Chemical computing group ULC, 1010 Sherbrooke St, West, suite 910. Montreal, QC, Canada, H3A 2R7; 2013.
7. Guo, D., et al., Modelling the assembly and flexibility of antibody structures. Current Opinion in Structural Biology, 2024. 84: p. 102757.
8. Park, E. and S. Izadi, Molecular surface descriptors to predict antibody developability: sensitivity to parameters, structure models, and conformational sampling. mAbs, 2024. 16(1).
9. Connolly, B.D., et al., Weak Interactions Govern the Viscosity of Concentrated Antibody Solutions: High-Throughput Analysis Using the Diffusion Interaction Parameter. Biophysical Journal, 2012. 103(1): p. 69-78.
10. Kingsbury, J.S., et al., A single molecular descriptor to predict solution behavior of therapeutic antibodies. Science Advances, 2020. 6(32): p. eabb0372.
11. Geng, S.B., et al., Measurements of Monoclonal Antibody Self-Association Are Correlated with Complex Biophysical Properties. Molecular Pharmaceutics, 2016. 13(5): p. 1636-1645.
Acknowledgements: The authors would like to acknowledge Katherine Joyner for her assistance and guidance with viscosity measurement. This work was funded by AstraZeneca. The authors report no conflicts of interest.
 Figure 1: Overview of HDX-guided mAb A protein engineering workflow. (A) Lyophilized mAb A was resuspended in deuterated buffer to 5 mg/mL and 60 mg/mL for HDX analysis. After quenching and pepsin cleavage, peptides with lower rates of H-D exchange in the 60 mg/mL condition were identified and (B) mapped to an IgG1 model built in MOE. MOE’s Protein Patches feature was used to calculate hydrophobic and electrostatic patches on a model of the Fv. (C) After cross-referencing the peptides from HDX experiments with the calculated surface patches, 70 variants were rationally designed, purified, and (D) experimentally evaluated in low concentration developability assays (≤ 1 mg/mL). Variants of interest with sufficient material were also tested for viscosity.
 Figure 2: mAb A Fv models for mutation design. Approximated Connolly Surface diagrams of a mAb A Fv model in MOE. Peptides from HDX experiments below the threshold ΔD value are yellow and/or have a dotted line border. Round 1 mutation sites are cyan, Round 2 mutation sites are salmon. Six of the mutation sites are within the HDX peptides, while an additional six residues are within 4.5Å of an HDX peptide residue.
 Table 1: Reversible self-association and viscosity of mAb A variants. DLS kD and AC-SINS values N = 3, n = 2, ± S.D. Apparent viscosity measured using a RheoSense VROC Initium rheometer. Variants highlighted in orange had less than a ten-fold loss in target binding with viscosity less than 11 cP at 150 mg/mL.